
Case studies / B2B
B2B association · 12 weeks
Same Membership, Very Different Prices
B2B Industry Association: Building a Customer Pricing Segmentation
- Client
- B2B industry association setting standards and selling advisory services
- Situation
- Prices set by a flat target-margin rule, some services never repriced since launch
- Insight
- Members with similar usage and profiles were paying very different prices, with a clear group of underpriced accounts
- Impact
- 15% of members repriced and a 5% revenue improvement, followed by a restructured offer and price schedule
- Engagement
- 12 weeks, including 4 weeks of data consolidation across billing records and offline spreadsheets
Executive Snapshot
The association set industry standards and sold high-value advisory services to its members. It faced little direct competition, and members joined for services they could not easily get elsewhere. Pricing had never been treated as a lever. Each service carried a price derived from a target margin, and some had not changed since they were launched. Leadership suspected there was money on the table but had no way to see where, or how much could be recovered without putting memberships at risk.
Data That Wasn't Built for Pricing
The first obstacle was the data itself. There was no central repository: critical tables lived in spreadsheets maintained offline, the billing system was not structured for analysis, and actual service usage by member was not captured at all.
Keenalytix consolidated these sources at the start of the engagement and set up processes so the client could keep the data clean afterwards. Without that step, any pricing conclusion would have rested on guesswork.
What the Data Revealed
Keenalytix analyzed 12 months of transactions across:
- price paid per service and per member
- member size, sector and purchasing history
- service mix and frequency of use
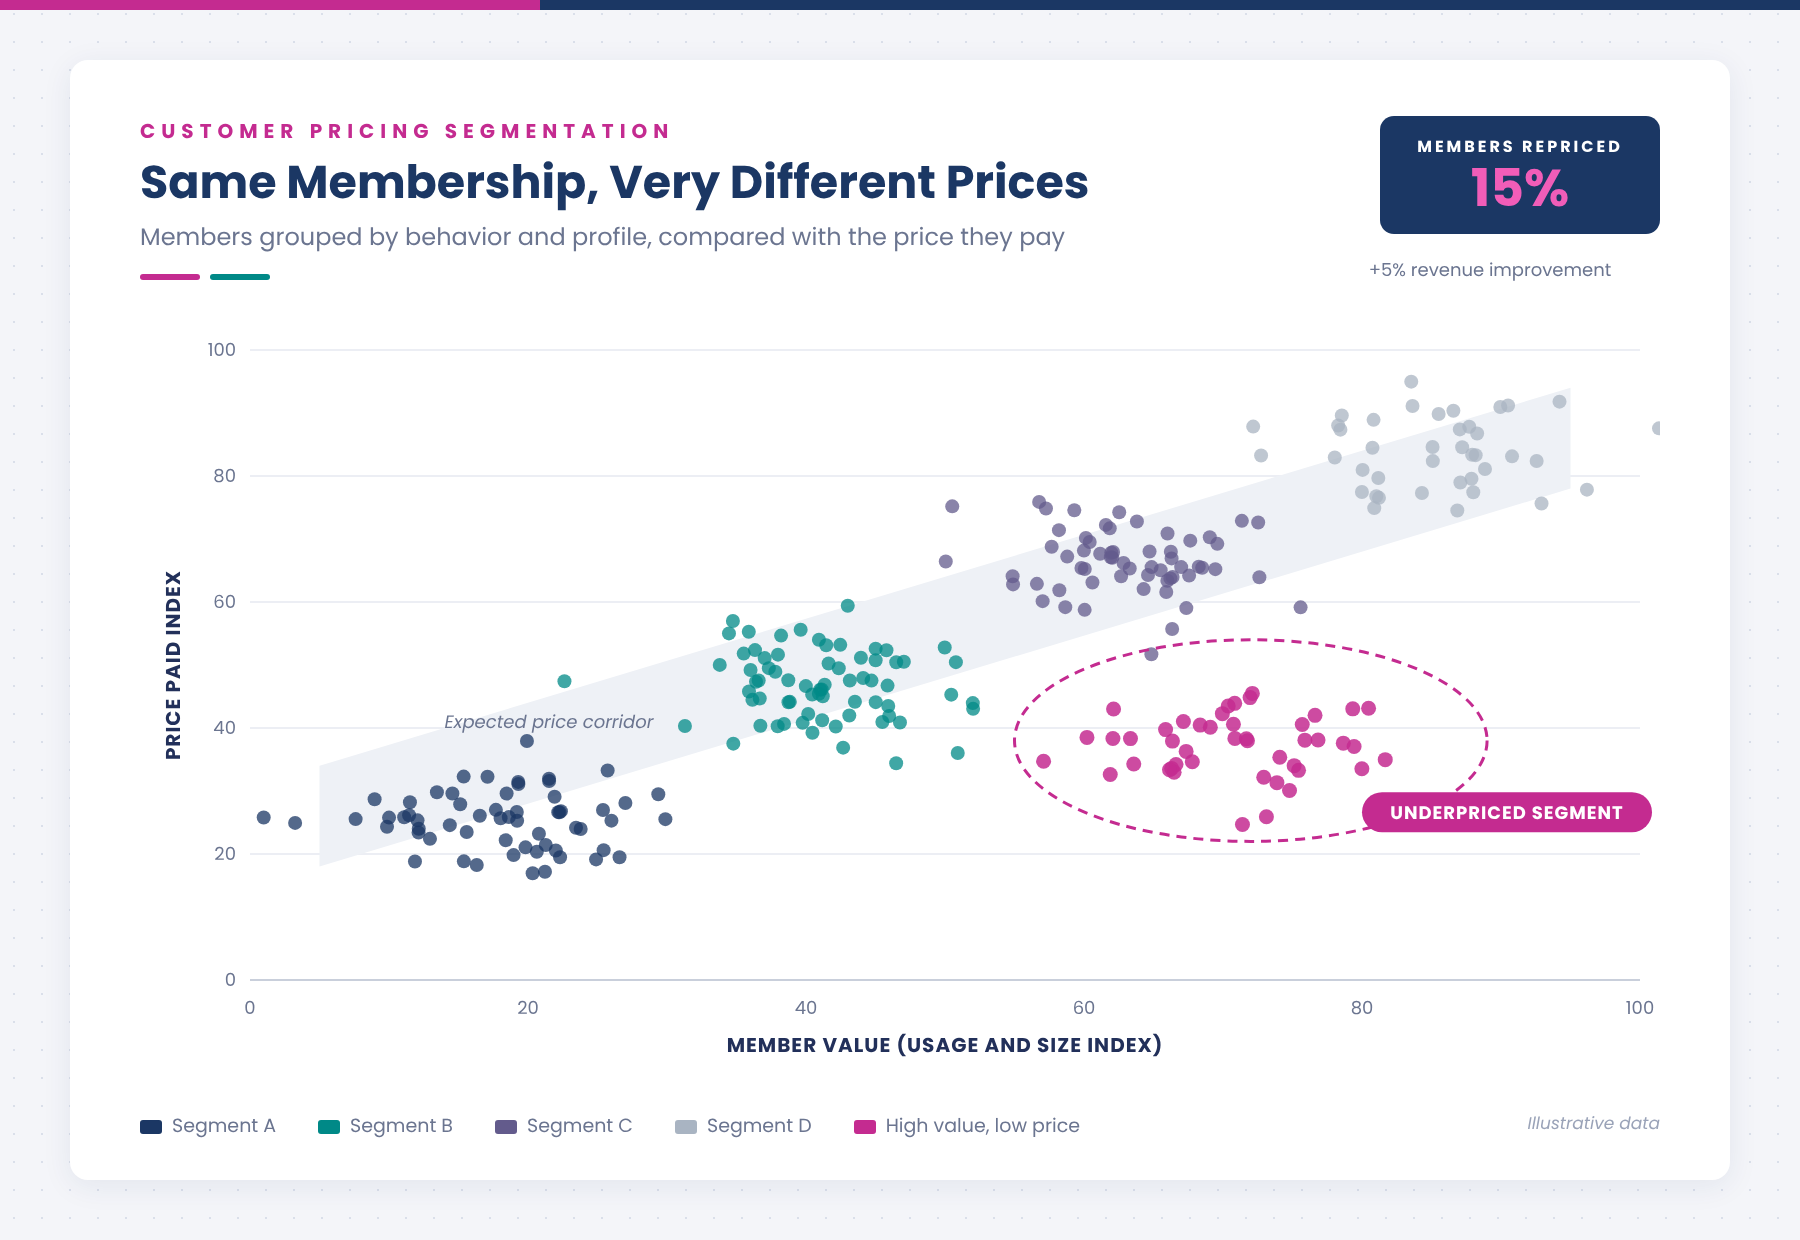
Price dispersion analysis showed that members with comparable profiles and usage were paying widely different prices. A cluster analysis then grouped members by purchasing behavior and firmographics into a small number of pricing segments. One segment stood out: high-usage members paying well below what similar members paid.
From Analysis to a Repricing Plan
Because losing members was the main risk, the repricing was gradual and targeted. Rather than a broad increase, the association adjusted prices for the underpriced segment first, service category by service category, so that no member faced an abrupt change.
Pricing dashboards gave the team an ongoing view of price dispersion, so new outliers could be caught before they became habits.
The Results
About 15% of members were repriced, delivering a 5% revenue improvement. With the segmentation in hand, the association went on to restructure its offer and price schedule around the segments rather than around cost.